Towards a Large Corpus of Richly Annotated Web Tables
for Knowledge Base Population
Authors: Philipp Braukmann, Lorenzo Cazzoli, Basil Ell*, Sherzod Hakimov*, Fabian Kaupmann, Amerigo Mancino, Junaid Altaf Memon, Kai Rother, Abhishek Saini
Statistics for Literal Linking Task
The plot represents the cumulative distribution of the number of hypotheses per tables.
Starting with 550 with more than 1 hypotesis and arriving to 1 with more than 106 hypotheses.
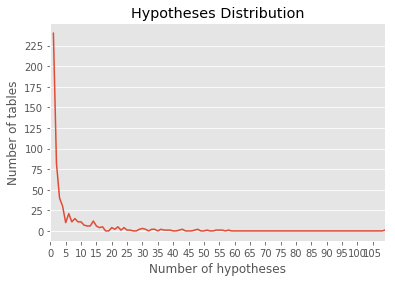
The plot shows the distribution of the number of hypotheses per table.
The majority of the tables have 1 to 5 hypotheses.
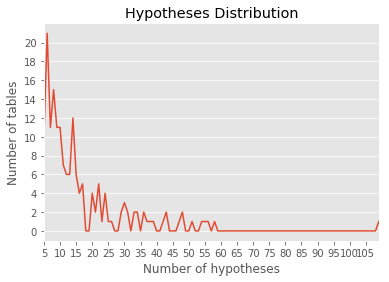
The plot shows the distribution of the number of hypotheses per table.
In this zoom it easier to understand the number of hypotheses for the table with more than 5 hypotheses.


